charts
-
Apache ECharts:An #opensource visualization library in #JavaScript. https://echarts.apache.org/en/index.html Also see https://chartscss.org/ #CSS #webtools #webdev #charts
-
lightweight-charts ( tradingview/lightweight-charts )
Performant financial charts built with HTML5 canvas Created by tradingview on May 24, 2019.
-
Why I 🧡 the web. "Gauge Generator" is a web app that generates gauge #charts and export them as PNG or code to be used in dashboard designs, projects, slides, etc. https://veerasundar.com/gauge-generator #JavaScript #React #Opensource
-

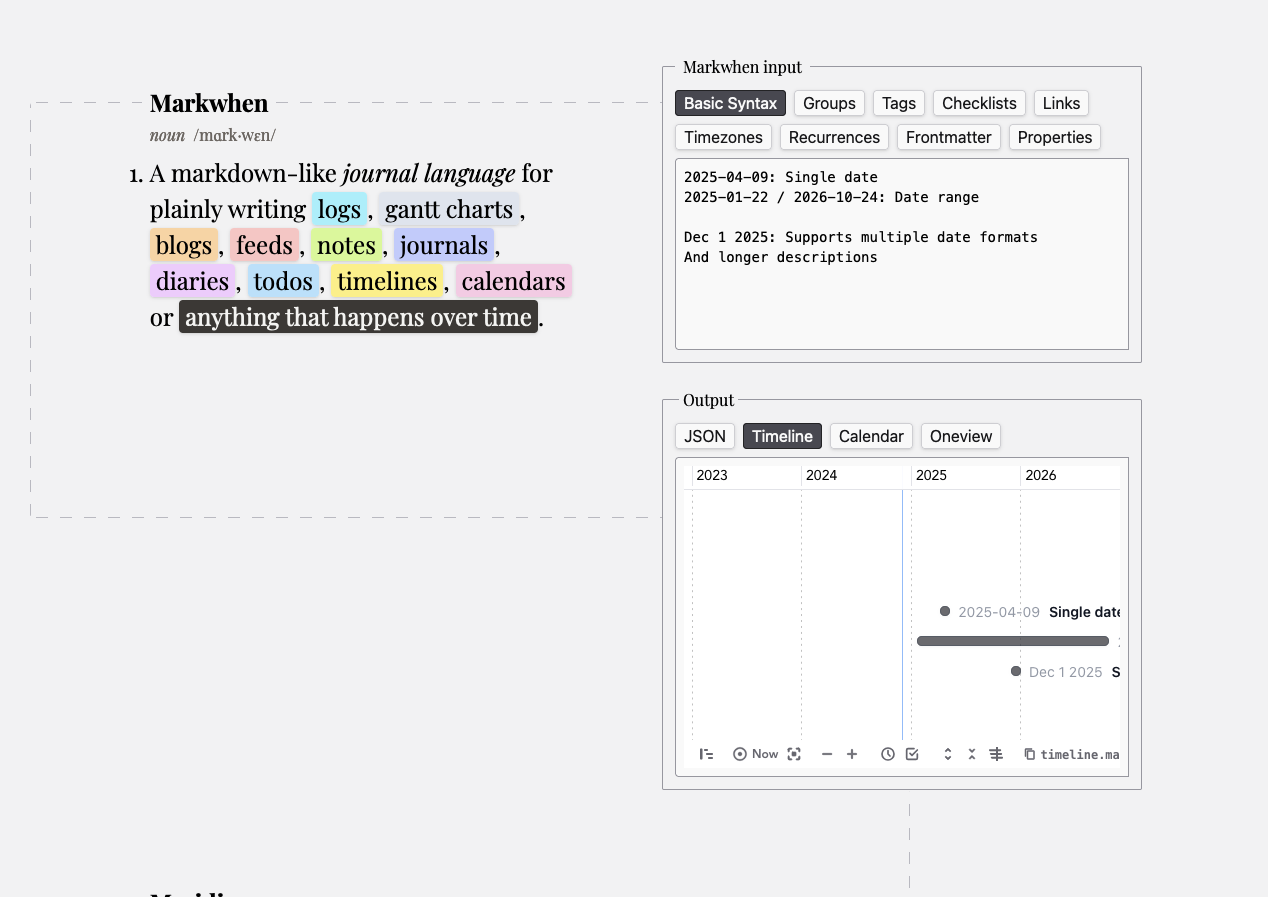
Interesting. Markwhen is #Markdown for Timelines https://markwhen.com/ I don't use markdown much, but for something like this i wouldn't mind something similar for quick things. There's also an editor… and a #VSCode extension. #charts #opensource
-

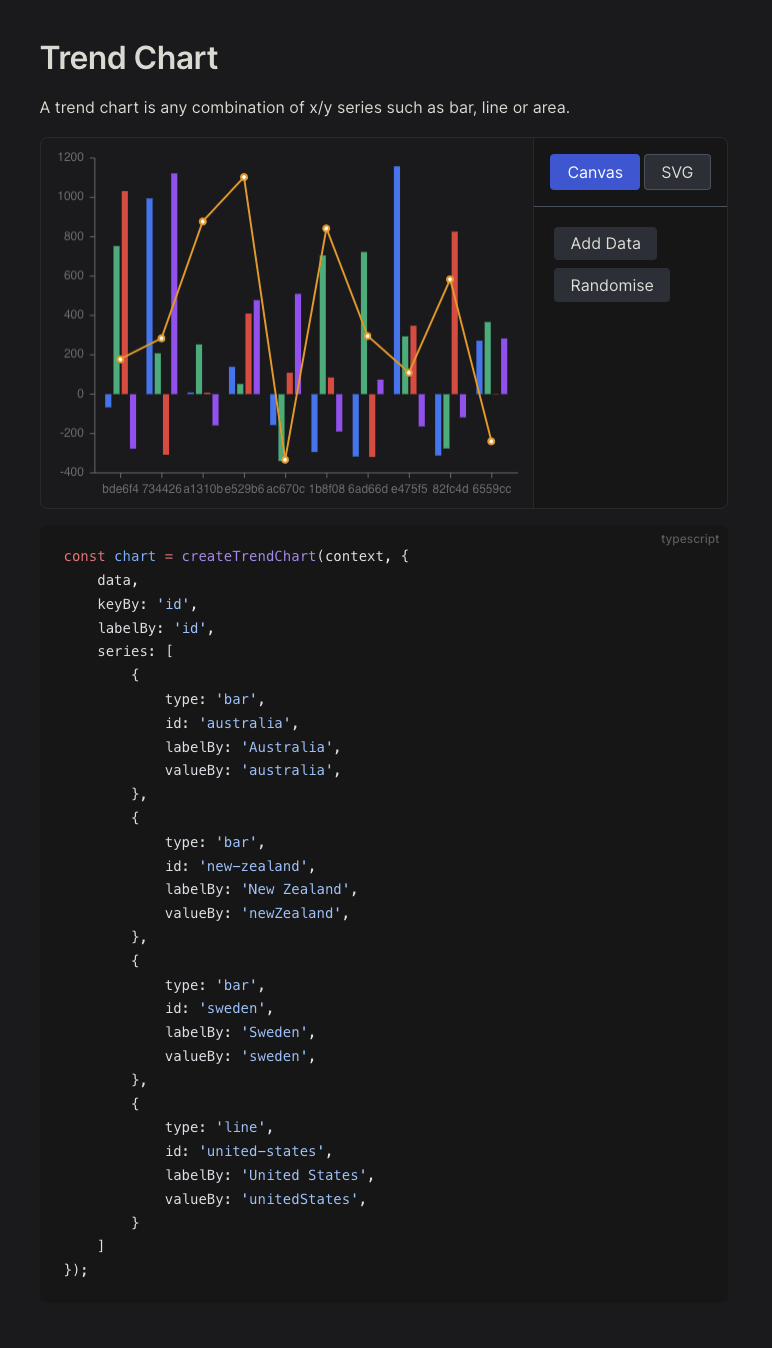
ripl is a #JavaScript library for data visualization in both #SVG and Canvas. #opensource https://github.com/andrewcourtice/ripl #charts
-

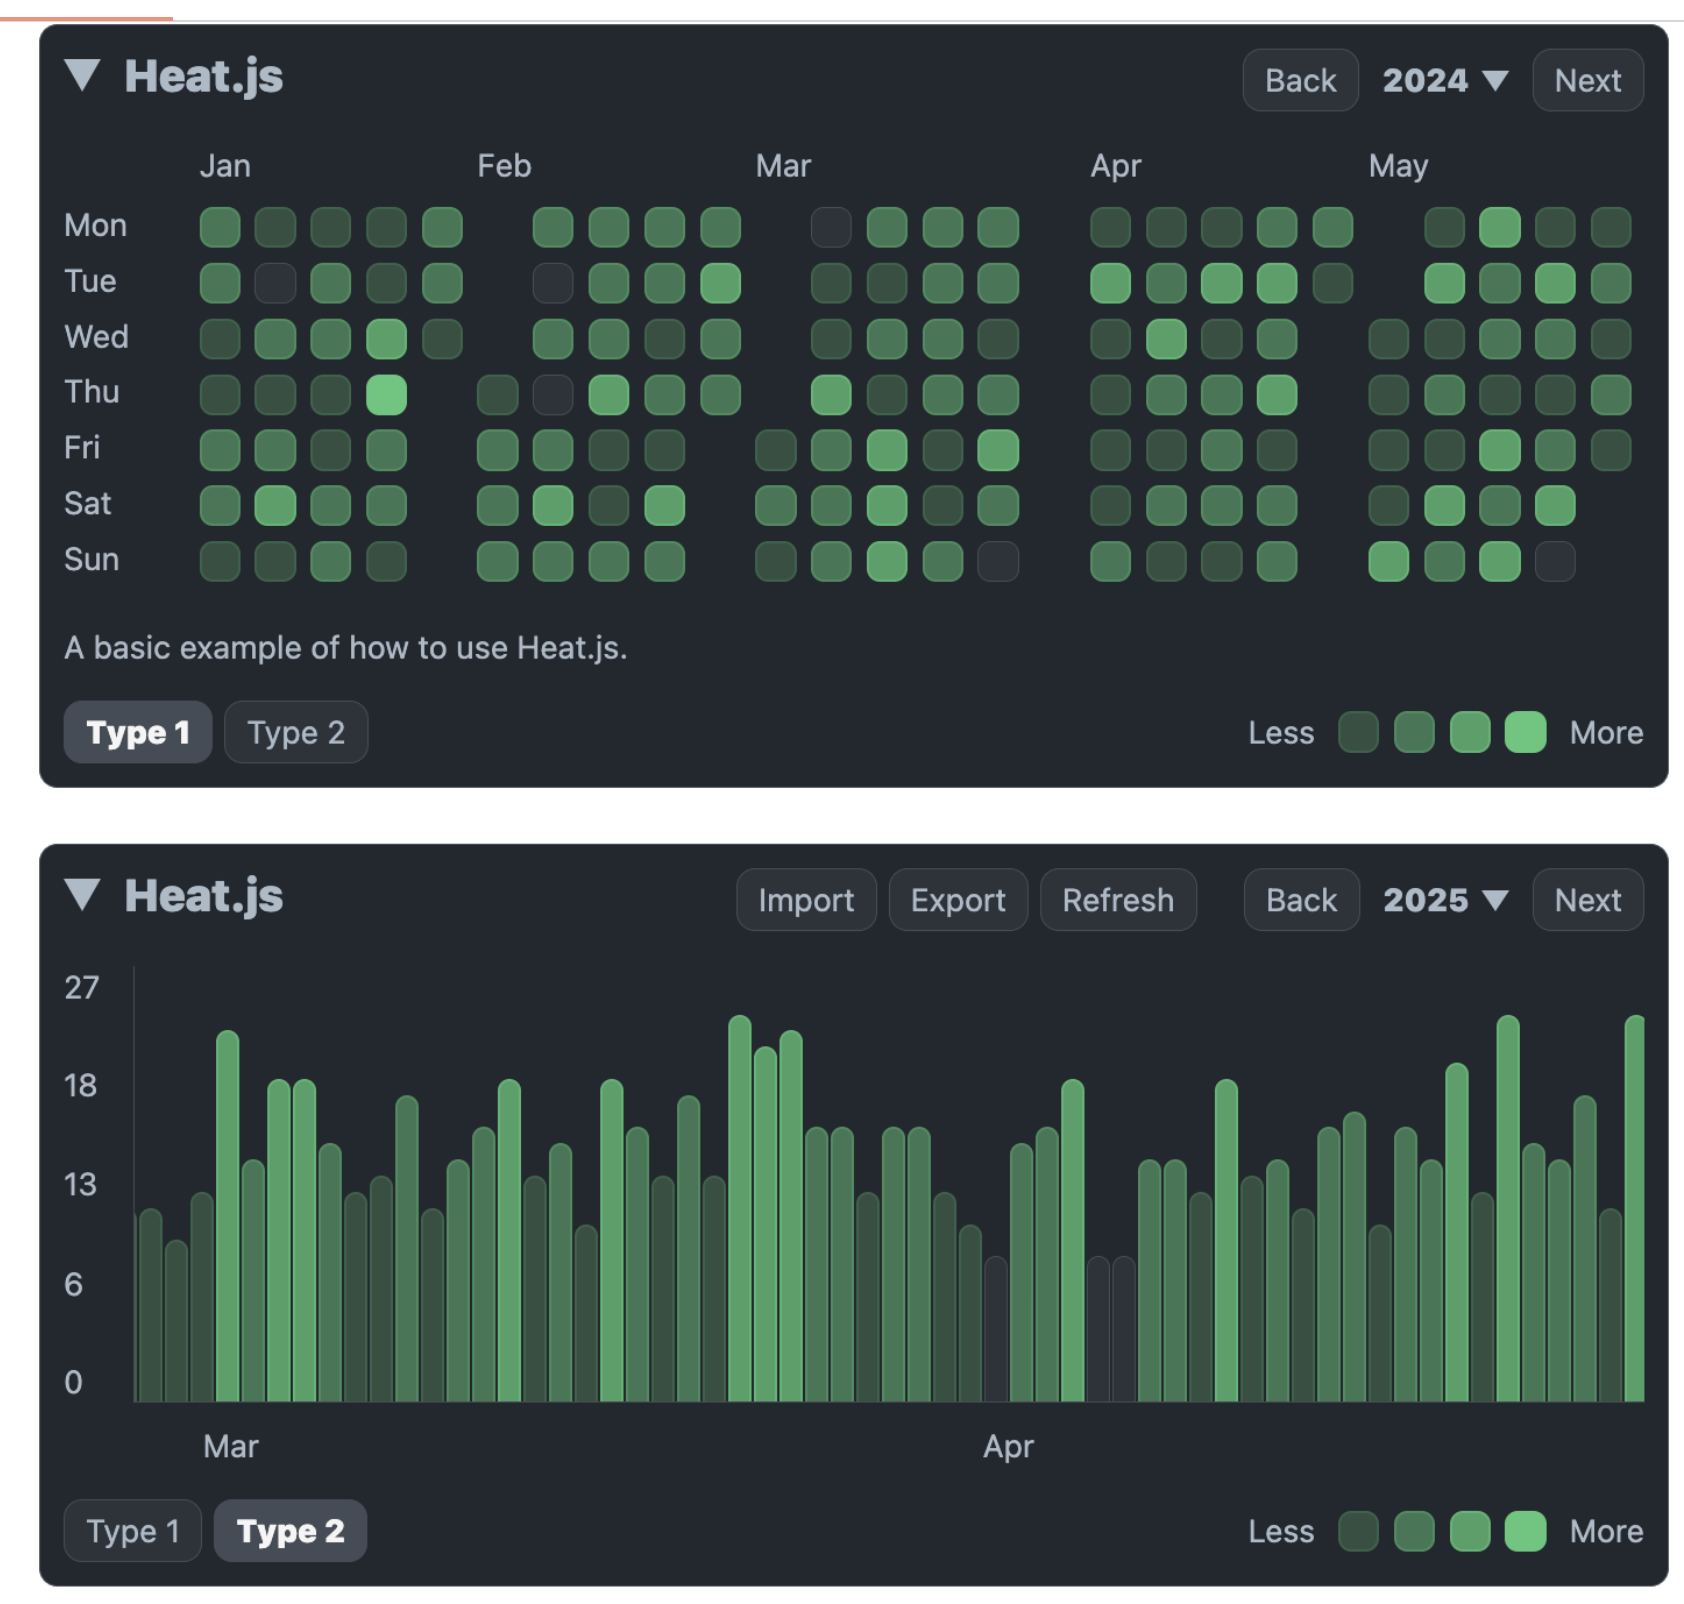
Heat.js is a "lightweight #JavaScript library that generates customizable heat maps, #charts, and statistics to visualize date-based activity and trends." #programming https://github.com/williamtroup/Heat.js
-
apexcharts.js ( apexcharts/apexcharts.js )
📊 Interactive JavaScript Charts built on SVG Created by apexcharts on Jul 24, 2018.
-
chartbrew ( chartbrew/chartbrew )
Open-source web platform used to create live reporting dashboards from APIs, MongoDB, Firestore, MySQL, PostgreSQL, and more 📈📊 Created by chartbrew on Aug 29, 2019.
-
charts.css ( ChartsCSS/charts.css )
Open source CSS framework for data visualization. Created by ChartsCSS on Sep 26, 2020.
-
uPlot ( leeoniya/uPlot )
📈 A small, fast chart for time series, lines, areas, ohlc & bars Created by leeoniya on Sep 27, 2019.